Table of contents
Sales teams today operate in an environment that demands agility, precision, and data-driven decisions. To stay competitive, businesses need tools that provide real-time insights and help align their strategies with performance goals. One of the most effective tools for achieving this alignment is a sales dashboard. By consolidating critical data into one accessible view, a sales dashboard empowers sales reps, managers, and leaders to track progress, identify opportunities, and make informed decisions that improve outcomes.
In this article, we’ll explore what a sales dashboard is, how it contributes to sales compensation strategies, and why it is a game-changer for modern sales teams. Along the way, we’ll discuss key components, real-world use cases, and tips for creating dashboards that boost performance and align with sales goals.
What is a sales dashboard?
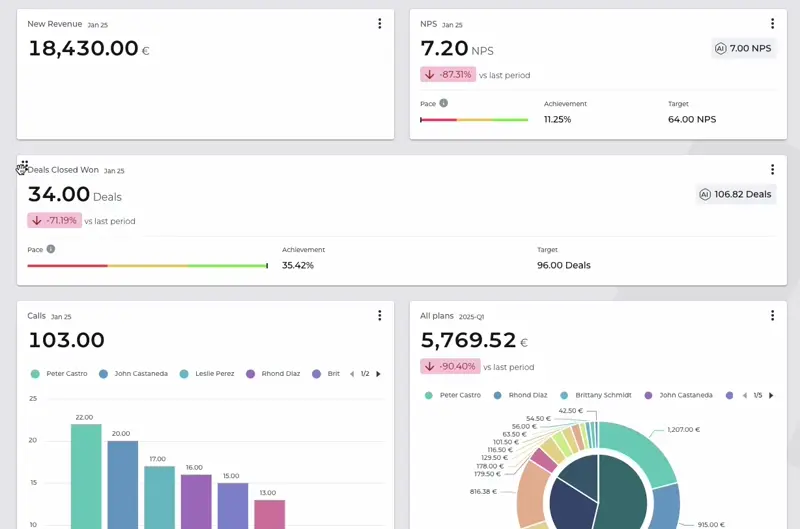
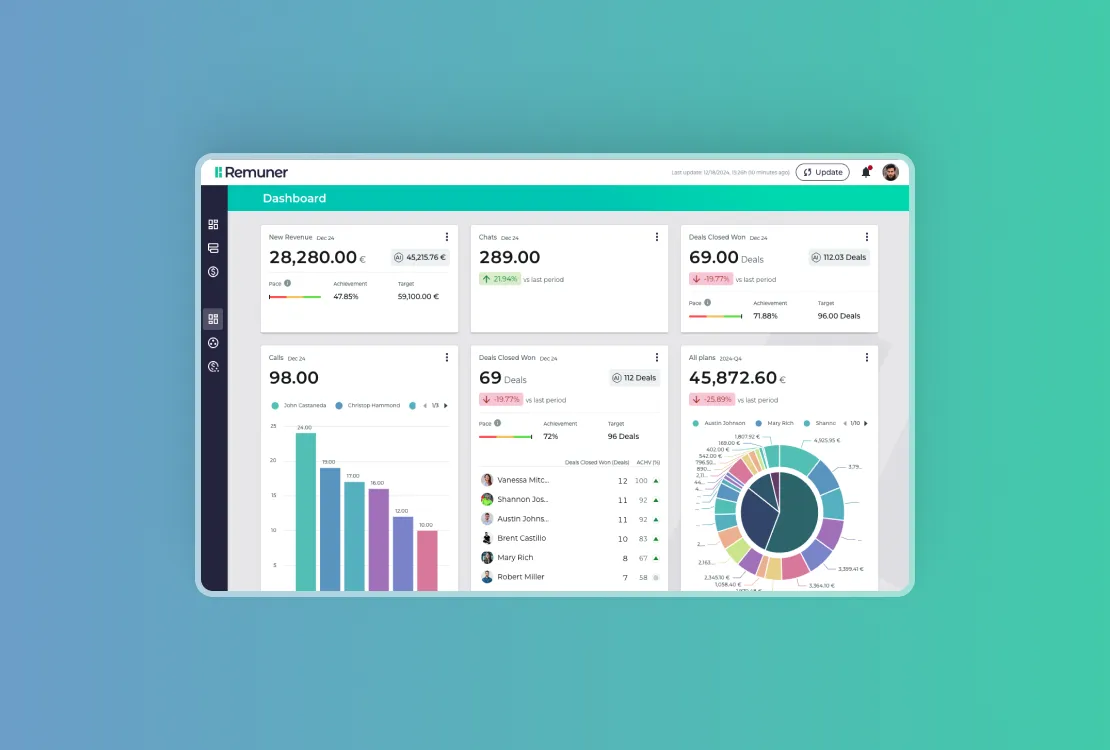
A sales dashboard is a visual interface that consolidates sales data into charts, graphs, and metrics, providing an at-a-glance overview of performance. It enables teams to monitor sales activities, track key performance indicators (KPIs), and gain insights into their sales process.
Dashboards can be tailored to focus on specific objectives, such as tracking sales incentives, analyzing win-loss rates, or monitoring open opportunities.
Sales dashboards are invaluable tools for ensuring that sales reps and managers stay aligned with their quotas and overall team goals. By presenting real-time data, they provide actionable insights that support data-driven decisions, allowing teams to adapt strategies on the fly.
Key components of an effective sales dashboard
To maximize the value of a sales dashboard, it’s essential to include metrics and features that align with your team’s specific objectives. Here are the most important elements:
- Sales metrics: Track KPIs such as sales conversion rates, revenue generated, and average deal size. These indicators reveal the health of your sales process and help teams identify areas for improvement.
- Sales performance dashboards: Compare individual and team performance to quotas and goals. This keeps everyone focused on hitting targets.
- Real-time data: Ensure dashboards update continuously to reflect the latest information, such as current open opportunities or newly closed deals.
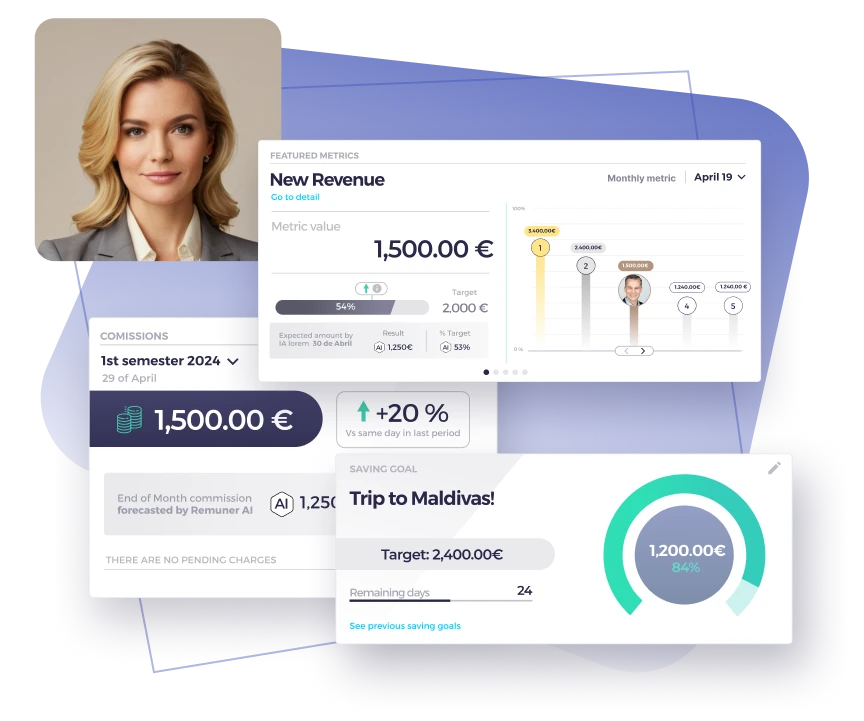
- Sales rep dashboard: Provide personalized views for individual team members, highlighting metrics like win-loss rate and progress toward sales incentives.
- Performance trends: Include visualizations for time periods (daily, weekly, monthly) to track how performance evolves over time.
- Sales reporting dashboard: Summarize key data for sales team meetings, ensuring discussions are focused and data-driven.
How sales dashboards improve sales compensation strategies
Sales compensation plays a pivotal role in motivating teams to perform at their best. A well-designed sales dashboard provides transparency and clarity, enabling teams to understand how their efforts impact their earnings. Here’s how dashboards enhance sales compensation:
- Align performance with sales incentives: Dashboards show sales reps exactly how their activities contribute to their compensation. This clarity boosts motivation and ensures alignment with organizational goals.
- Optimize quota setting: Analyze historical data to set realistic, data-driven quotas. Dashboards help leaders track whether quotas align with market trends and team capabilities.
- Track OTE achievement: OTE (on-target earnings) is a critical metric in sales compensation. Dashboards let reps monitor their progress toward their OTE in real time, fostering accountability.
- Identify top-performing reps: Recognize high achievers by analyzing their metrics, such as conversion rates and revenue contribution. Use this data to refine incentive plans and retain talent.
- Enhance fairness: By providing a transparent view of performance, dashboards eliminate ambiguity, ensuring that compensation is tied to measurable results.
Examples of sales dashboard use
Sales dashboards are versatile tools that can serve various purposes depending on team goals. Here are a few examples:
1. Tracking sales conversion rates
A sales manager at a SaaS company uses a dashboard to monitor conversion rates at each stage of the sales funnel. By identifying bottlenecks, the team optimizes their follow-up strategies, increasing deal closure rates by 15% in one quarter.
2. Monitoring open opportunities
An e-commerce business tracks open opportunities in real time. The dashboard highlights deals at risk of stalling, allowing sales reps to prioritize their outreach effectively.
3. Analyzing win-loss rate
A sales team in the manufacturing sector uses a dashboard to track win-loss rates by product category. This helps them adjust their focus to higher-performing categories, driving a 20% increase in sales.
4. Improving sales team meetings
A tech startup’s sales team meetings are transformed with dashboards that summarize KPIs and recent trends. Discussions become more actionable, focusing on solutions rather than anecdotal observations.
5. Supporting multiple sales teams
A multinational corporation’s sales leader uses dashboards to compare performance across regional teams. This helps them identify best practices and replicate success across all teams.
Using Remuner’s dashboards for sales performance
Remuner’s dashboards are designed to provide unparalleled visibility and actionable insights for sales teams, leaders, and organizations. By integrating seamlessly with your existing systems, they deliver real-time data that empowers every team member to excel.
1. Real-time performance tracking
Remuner’s dashboards allow sales reps to track their progress toward quotas, OTE, and sales incentives in real time. With personalized views for each rep, they can identify areas to improve and focus on high-priority sales activities.
2. Enhancing team competition
The dashboards include gamified elements, such as leaderboards and achievement badges, fostering healthy competition among sales reps. This motivates individuals to push harder and align their efforts with team goals.
3. Data-driven decision-making for leaders
Sales leaders benefit from comprehensive performance dashboards that consolidate data across multiple sales teams. By comparing regional or team-specific results, leaders can identify trends, replicate successful strategies, and address bottlenecks effectively.
4. Simplifying sales team meetings
Use Remuner’s dashboards to make sales team meetings more impactful. With clear, real-time data at your fingertips, discussions can focus on actionable insights rather than gathering information.
5. Customizable to your needs
Every organization has unique metrics that matter most to its success. Remuner’s dashboards are fully customizable, allowing you to tailor them to your specific sales goals, KPIs, and time periods. Whether tracking open opportunities, win-loss rates, or sales conversion rates, your team gets the data it needs to succeed.

Tips for creating an effective sales dashboard
To maximize the impact of your sales dashboards, follow these best practices:
- Define clear objectives: Decide what you want to achieve with your dashboard. Are you focusing on improving sales performance, tracking compensation alignment, or monitoring team efficiency?
- Choose relevant KPIs: Select metrics that align with your goals. Avoid cluttering the dashboard with unnecessary data.
- Keep it simple: Use clear visuals and avoid overwhelming users with too much information. Prioritize readability.
- Update data in real time: Ensure your dashboard pulls live data from your systems to provide the most accurate insights.
- Customize for roles: Tailor dashboards for different users. Sales reps, managers, and executives each have unique needs.
- Leverage gamification: Use leaderboards and progress trackers to create healthy competition among team members.
- Integrate seamlessly: Ensure your dashboard connects with CRMs, ERPs, and other tools to provide a comprehensive view of sales activities.
Why sales dashboards are essential for sales performance
Sales dashboards are more than just reporting tools; they are strategic assets that empower teams to improve their performance. By providing visibility into sales goals, open opportunities, and other key metrics, dashboards enable teams to:
- Make data-driven decisions: Analyze trends and adjust strategies based on concrete data.
- Boost motivation: Show progress toward sales incentives and OTE, keeping teams focused and driven.
- Identify and address issues: Detect bottlenecks in the sales process and resolve them quickly.
- Enhance accountability: Provide transparent insights into individual and team performance.
Improve your own dashboards and reporting
A sales dashboard is a powerful tool that transforms raw data into actionable insights, helping teams achieve their goals while aligning with sales incentives and compensation plans. Whether you’re tracking quotas, analyzing performance trends, or supporting multiple sales teams, dashboards provide the clarity and focus needed to succeed in today’s competitive landscape.
By following the tips outlined in this article and focusing on the examples shared, you can create a sales dashboard that drives performance, motivates your team, and helps your business achieve sustained success.


